There's many ways scientists can analyze their RNAseq data, which meant I needed to strike a balance between giving smart defaults and giving flexibility. I focused on an opinionated set of tools that would meet the analytical needs for 85% of our users, while introducing tweakable parameters and views to each of these tools. Our three main analysis tools allowed users to:
- Pick genes they want to see gene expression of in real time.
- Generate volcano plots from pairwise comparisons to identify lists of "top hit" genes.
- Contextualize gene hits with functional pathway grouping to show if entire functions were being affected by a treatment condition
Interactive data exploration
RNAseq analysis is fundamentally a non-linear investigation. A researcher doesn't ask one question and move on. They ask a question, get a partial answer, and immediately need to interrogate that answer from a different angle. Unfortunately, RNAseq analysis results have historically been shared on static slides, which puts a huge obstacle to following up any additional investigative threads. I took advantage of our browser-based implementation and heavily used interactivity to connect the dots between our analysis tools. Users could follow up on threads of investigation in a single gesture.
The persistent gene picker at the top externalizes a user's working hypothesis: "These are the genes I am currently thinking about." The volcano plot on the left shows which genes are top hits for differential expression, and pathways with the most differential expression are bubbled to the top. Clicking on a functional pathway closes the loop for investigation by adding them into the gene picker.

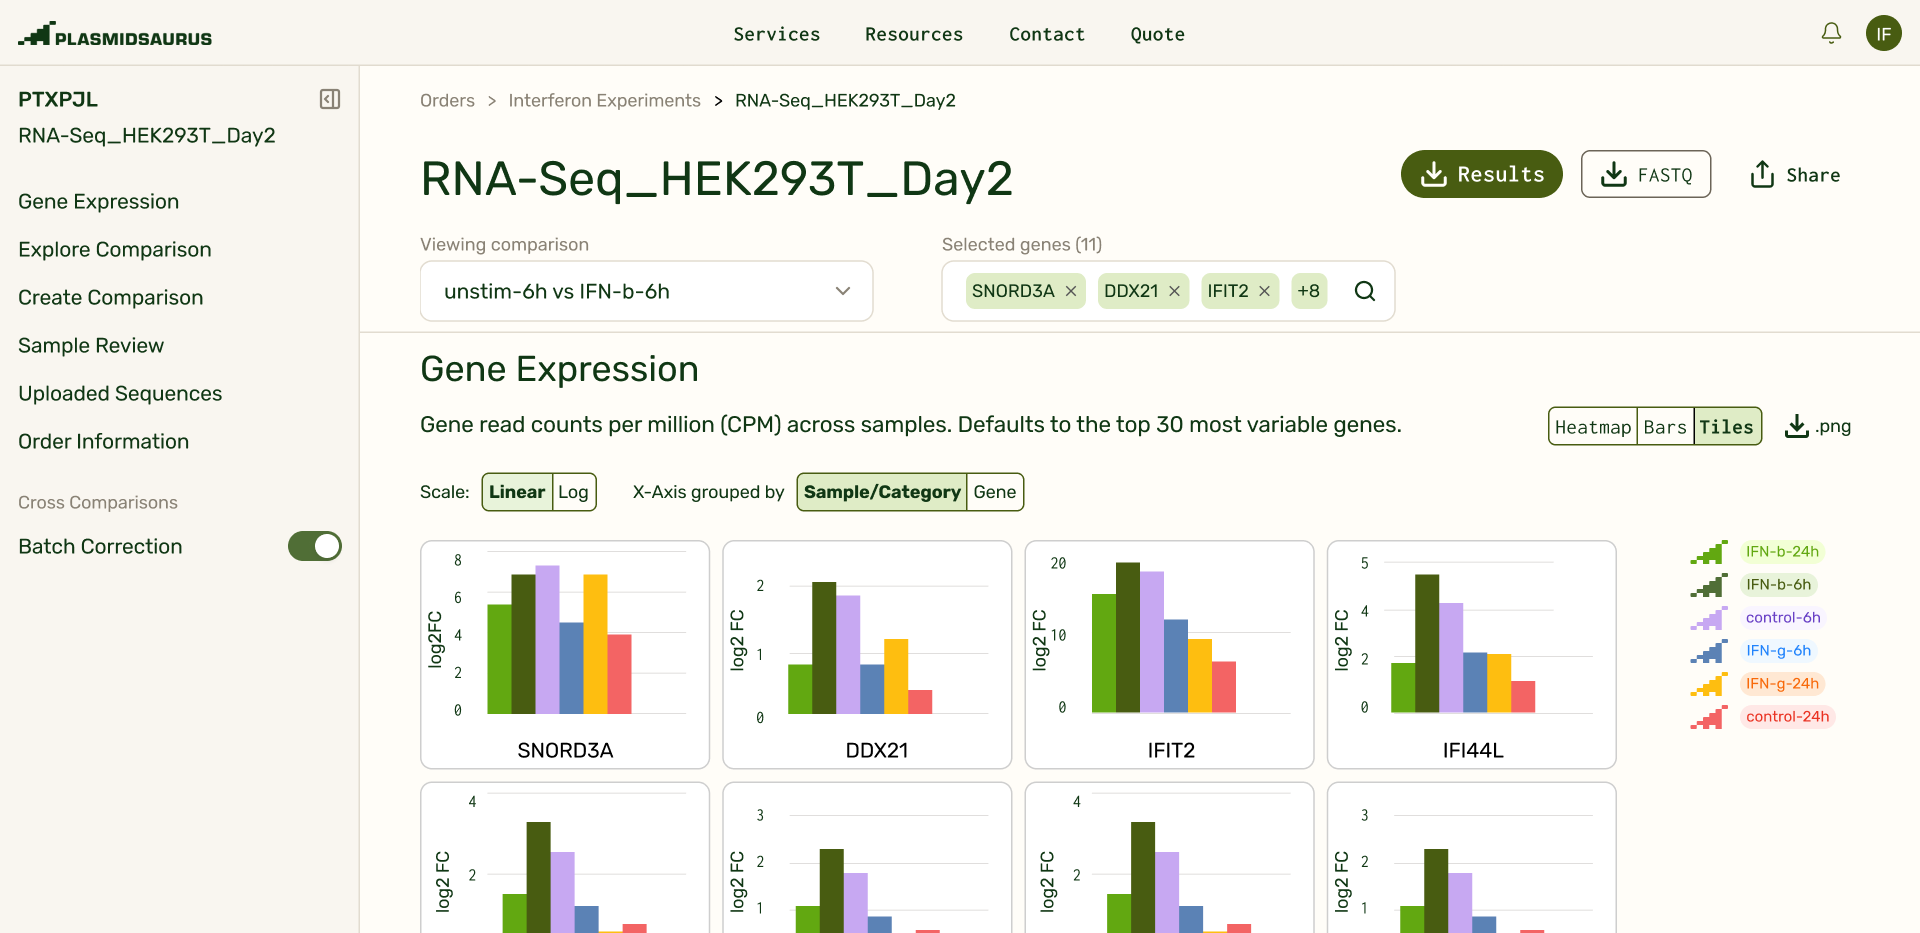
By using a default of "30 Most Variable Genes" in the gene picker, users immediately land on interesting, explorable data when they open their results delivery. Saved gene lists allowed users to bookmark investigative threads. The expression plot shown is optimized to be performant when pulling expression data from any of the ~20,000 genes (rows) across >100 samples (columns).
AI Tools for Scientists
I conducted a research sprint to understand how users were already using LLMs with their data, what built and lost trust, and what ways agentic interactions could provide the most value. What emerged was that our users:
- Wanted to understand the transcriptional impact of their experimental variables as quickly as possible.
- Relied on LLMs for methodology of higher-complexity analyses, but still wanted to independently run analysis for papers or meetings.
- Needed to understand how data quality issues impacted results, and how to adjust analysis accordingly.
Based on these findings, I focused on designing an agentic chat that was an analytical co-pilot rather than an interpreter. The agent is able to compare with literature, explain analyses, even change the state of the page — filters, groupings, plot generation — but does not tell scientists what it means or what the next experimental step is. The focus was quickly expanding the surface of analysis (removing the manual step of putting together individual comparisons and plots) without generating scientific conclusions for the scientist.
Based on the user's instructions to follow up on a specific treatment condition (M1), the agent is able to identify the right set of comparisons, pull the top set of gene hits, and pull up the expression heatmap at the top of the page to show expression for relevant genes in that condition (M1) compared to a control (undifferentiated).
We also use LLMs to remove tedious tasks such as categorizing replicate samples into the same treatment category, or generating pairwise comparisons based on sample or category name.